

BCG matrix
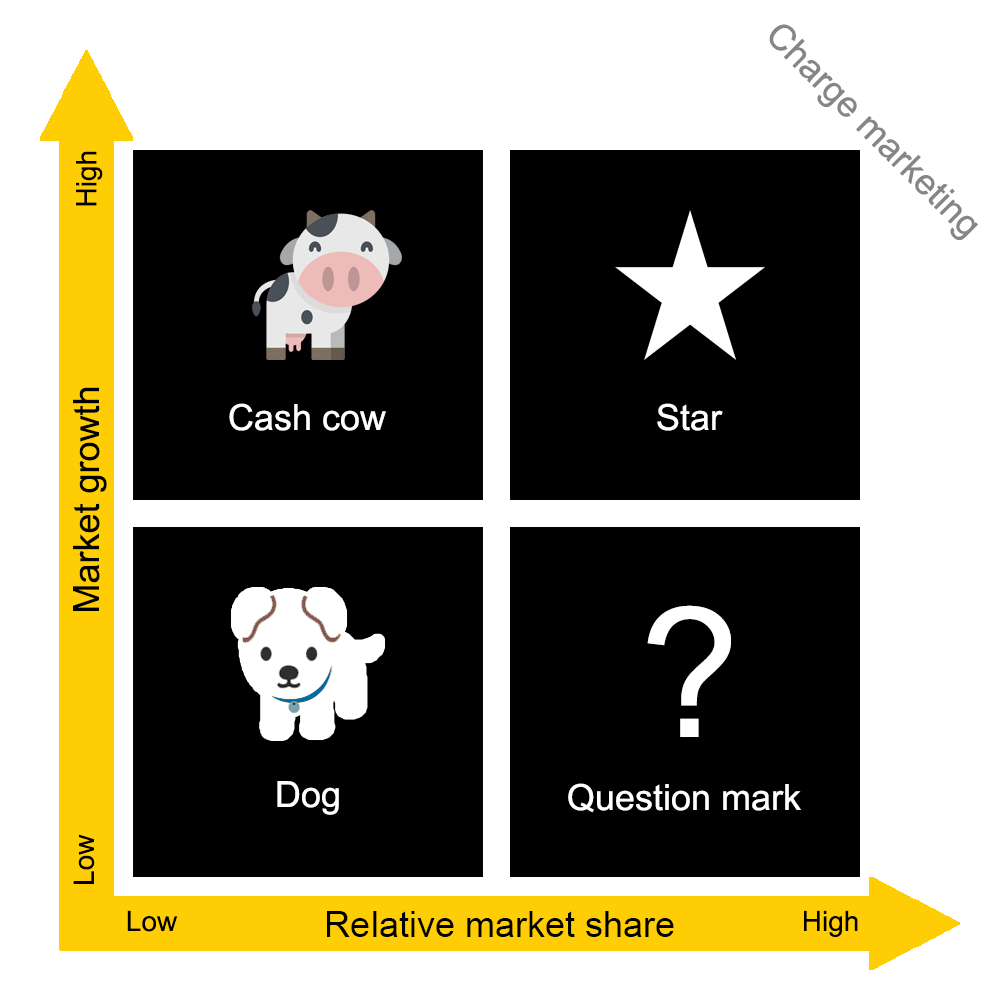
The BCG matrix is a 2×2 matrix that classifies a company’s products or services based on their market share and growth rate. The matrix is divided into four quadrants: Stars, Cash Cows, Question Marks, and Dogs.
- Stars: These are products or services with a high market share and a high growth rate. They are the company’s future cash cows and require substantial investments to sustain their growth.
- Cash cows: These are products or services with a high market share but a low growth rate. They generate a steady income stream for the company and require minimal investments.
- Question marks: These are products or services with a low market share but a high growth rate. They have the potential to become stars but require significant investment to achieve that status.
- Dogs: These are products or services with a low market share and a low growth rate. They do not generate significant revenue for the company and are often candidates for divestiture or liquidation.
When should you use the BCG matrix ?
The BCG matrix is most effective when a company has a diverse range of products or services. It is particularly useful when a company is considering entering a new market or launching a new product. By using the BCG matrix, a company can determine whether the new product or service is likely to become a star, cash cow, question mark, or dog.
Why use the BCG matrix ?
The BCG matrix provides a simple and effective way to analyze a company’s product or service portfolio. By categorizing products or services into one of the four quadrants, a company can identify which ones require investment and which ones should be divested or liquidated. This analysis helps companies make informed decisions about how to allocate their resources to maximize profitability.
How does the BCG matrix work ?
The BCG matrix divides a company’s portfolio into four categories based on market attractiveness (market growth) and competitive position (relative market share). These two dimensions provide insights into the potential profitability of products or product lines. This helps companies make informed decisions about where to invest and what to divest.
- Relative Market Share: One of the dimensions is relative market share. According to the model, higher market share results in higher returns because a company that produces more benefits from economies of scale and holds a better position on the experience curve, leading to higher profits. However, it’s important to note that some companies may enjoy the same advantages with lower production and lower market share.
- Market Growth: High market growth often results in higher revenue and sometimes higher profits. However, significant investments are often required to stimulate further growth. Business units operating in rapidly growing markets often require substantial investments due to the potential future perspective. It’s crucial to consider the potential growth and the ability to retain market share in the future.
Based on the above dimensions, four quadrants can be established, categorizing products, product lines, brands, or companies:
- Dogs: Dogs have a low market share compared to competitors and operate in a slow-growing market. Generally, they are not worth investing in as they often yield low or even negative returns. However, this is not always the case. Dogs can be profitable for an extended period, contribute synergies to other business units, or serve as a defense against unexpected moves by competitors. It’s important to conduct a deeper analysis of a dog to determine whether investment is needed or if they should be divested.
- Cash Cows: Cash cows are the most profitable components and should be “milked” to maximize profits. It is often suggested that returns from cash cows should be invested in stars to support further growth. According to the BCG matrix, companies should not invest in cash cows to induce growth but should only invest to maintain market share.
- Stars: Stars operate in rapidly growing sectors and have a relatively high market share. They generally generate income but also require substantial investments. Stars are the key units in which companies should invest money, as they are expected to become cash cows and generate positive cash flows. However, not every star will ultimately become a cash cow, especially in rapidly changing industries where innovative products can quickly be outcompeted by new technological developments.
- Question Marks: Question marks require attention. They have a relatively low market share in a rapidly growing market, often resulting in losses for organizations. Question marks have the potential to gain market share and become stars, but even significant investments do not guarantee that question marks will eventually become stars. If it fails to gain more market share, question marks will eventually become dogs. Therefore, organizations need to pay significant attention to analyzing whether question marks are worthwhile.
Using the BCG Matrix
While BCG analysis has lost some of its significance due to various limitations, it can still be a useful tool if the following steps are executed.
- Select the Unit: The BCG matrix can be used to analyze individual brands, products, product lines, or an entire enterprise as a unit. The choice of the unit will impact the entire analysis. Therefore, it is essential to accurately determine the unit for which you are conducting the analysis.
- Define the Market: Defining the market is one of the most crucial tasks in this analysis. This is because an incorrectly defined market can lead to misclassification. For example, if the analysis is conducted for the Daimler Mercedes-Benz automotive brand, it may end up as a “dog” when passenger cars are used as the market. However, it could be a “cash cow” when the market is defined as the luxury car market.
- Calculate Relative Market Share: Relative market share can be calculated in terms of revenue or market share. It is computed by dividing your brand’s market share (revenue) by the market share (or revenue) of your largest competitor in the market. For example, if your competitor’s market share is 25%, and your organization’s market share is 10% (in the same year), then your relative market share is 0.4. Relative market shares are displayed on the x-axis of the model, with 1 on the left, 0.5 in the middle, and 0 on the right.
- Determine Market Growth: Industry growth can often be found in industry reports, which are often freely available online. It can also be calculated by examining the average revenue growth of leading companies in the industry. The growth percentages mentioned on the y-axis can vary significantly between analyses, so there is no fixed percentage for this axis.
- Draw Circles on the Matrix: After calculating all components, you should be able to place the chosen units on the matrix. This is done by drawing a circle, with the size of the circle corresponding to the revenue of that unit.
Example of the BCG matrix
Let’s take the example of a company that produces electronic devices. The company has four products: smartphones, tablets, laptops, and smartwatches. The market share and growth rate of each product are currently classified as follows:
- Smartphones: High market share and high growth rate.
- Tablets: Low market share and high growth rate.
- Laptops: High market share and low growth rate.
- Smartwatches: Low market share and low growth rate.
Using the BCG Matrix, we can categorize each product into one of the four quadrants:
- Smartphones: Star.
- Tablets: Question mark.
- Laptops: Cash cow.
- Smartwatches: Dog.
Based on this analysis, the organization should consider investing in the development of new smartphone technology to maintain its market position. The company should also contemplate investing in the growth of the tablet market, as it has the potential to become a star. The company needs to continue generating revenue from its laptop market while minimizing investments, and it may consider divesting its smartwatch market as it does not generate significant revenue.
In conclusion, the BCG Matrix is an essential strategic management tool that can help companies effectively analyze their product or service portfolio. By categorizing products or services into one of the four quadrants, companies can make informed decisions on how to allocate their resources to maximize profitability.
References
- Madsen, D. O. (2017). Not dead yet: the rise, fall and persistence of the BCG Matrix. Problems and Perspectives in Management.
- Hambrick, D. C., MacMillan, I. C., & Day, D. L. (1982). Strategic attributes and performance in the BCG matrix A PIMS-based analysis of industrial product businesses. Academy of Management Journal.
- Mohajan, H. (2017). An analysis on BCG growth sharing matrix.
